

Tuesday’s budget increased State spending significantly, with permanent expenditure rising by about 6 per cent and a host of other once-off commitments. Total annual spending is now not far off €100 billion.
But we know that in some cases public services are inadequate and the State has huge infrastructure needs. So should the Government be spending even more, or do we need to get better value for what we are already spending? New research from the Economic and Social Research Institute (ESRI) provides evidence of the longer-term trends in Irish State spending and how it compares internationally. So what does it show?
1. The top-line trend
Irish Government spending trends can be hard to judge, as the traditional measure comparing it with the size of gross domestic product (GDP) does not work well, given the distortion caused to this figure by the activities of multinationals.
In a new study in its latest quarterly commentary, the ESRI takes a different approach, looking at spending per head of working-age population (the standard definition here is people aged between 15 and 64).
How crucial are US pharma firms to Ireland? And what happens if Trump entices them home?

In an era of rising property prices, the rich in Ireland are only getting richer
The latest housing crisis ‘solutions’: Which could work and which are hare-brained?
Remote working is here to stay and has whole new language about ‘hidden hybrid’ and ‘mouse jiggling’

This is not a perfect measure either – it does not, for example, take into account the impact of inflation. But it still does provide a revealing insight into the way spending has moved over recent years and – crucially – provides a level playing field to compare spending with other countries in the EU.
So what do the figures show? The overall level of Government expenditure per head of working-age population, as shown in the first graph, has risen continuously since the mid-1990s, with the exception of the period of big cutbacks after the financial crash. The lingering political and economic impact from this period is put into some context by this.
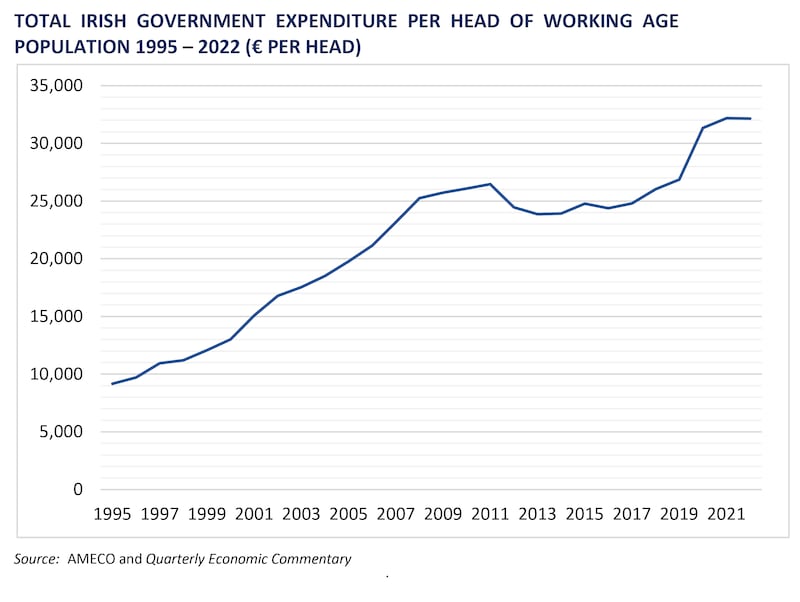
On a per-capita basis, Government spending levels reached the previous highs of the pre-crash period only in 2019, a reflection both of the extent of the cuts and of a rising population level.
On a per-capita basis, the figures show spending remaining at this higher 2019 in subsequent years – again the higher level of population is at play here – though there was a spike in current spending in 2020 and 2021 due to Covid supports.
2. The spending breakdown
Government spending breaks down into two main baskets – current or day-to-day spending on providing services and capital investment spending.
So it is useful to look at separate trends in these two areas. The second graph shows the big increase in day-to-day spending during the Celtic Tiger years from €8,000 per head in1995 to €22,800 in 2012.
The figure remained stuck at that level until 2018 and then jumped ahead during Covid-19 and the cost-of-living crisis to €28,500 per head last year.
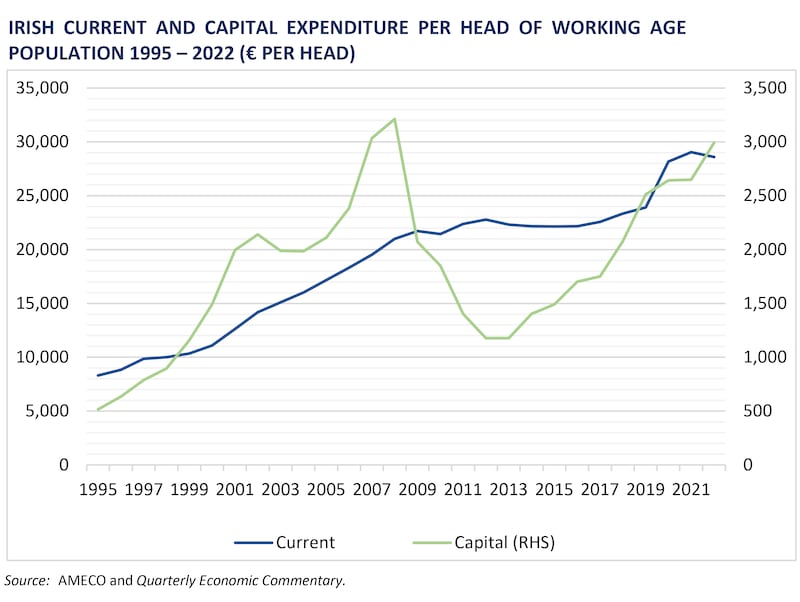
While we don’t know how quickly the population might grow next year, the per-capita figure will certainly approach €30,000 in 2024 when the once-off measures are counted in as well as the permanent changes. (On the basis of a constant population and the back of an envelope the budget would add about €1,300 to spending per head)
The trend in capital spending per head shows a different story. It collapsed after the financial crash, dropping from €3,312 per head in 2008 to €1,200 in 2012 and 2013.
The result has been seen in the lack of State-built housing and shortcomings in areas like water and energy. Part of the State investment boost now, which continued on budget day, is effectively a catch-up for this. Again the rising population is having an impact – capital spending per head is now back over €3,000 per capita, though is still below the – then unsustainable- post financial crash level.
3. How does Ireland compare?
Ireland ranks 10th highest among the EU-27 for current spending in the most recent year, while ranking fifth for capital spending.
Adjusting for these, in terms of current spending Ireland ends up roughly where it might be expected to, below the high-spending and big-state Scandinavian countries and the likes of France, the Netherlands and Germany but above Italy, Spain Portugal and the newer members states to the east.
Interestingly, Ireland’s current spending has not varied much by European Union standards over recent years, as the State also ranks 10th on average between 2010 and 2022. The traditional GDP measure would have Ireland as one of the richest states – and thus we might expect to be higher up the State spending league – but this figure is distorted by the multinational factor.
Irish investment spending has varied in the league table over the years, however, averaging eighth for 2010 to 2022. This reflects the impact of the sharp fall in spending in this area after the financial crash. Ireland’s ranking in terms of capital spending per head was as high as second in 2007 and then fell sharply to 10th in 2012 and 2013.
4. Taking a different measure
The ESRI study also looked at spending as a percentage of the new measure designed to factor out the distorting part of multinational activity – gross national income star (GNI*).
This shows that total spending averaged about 40 per cent of GNI* between 1995 and 2022 and – after a Covid spike – returned to roughly this level last year.
The figure peaked at 64 per cent in 2011, a reflection of the collapse of the size of the economy after the crash, with the actual cuts in spending levels gathering pace over the subsequent years.
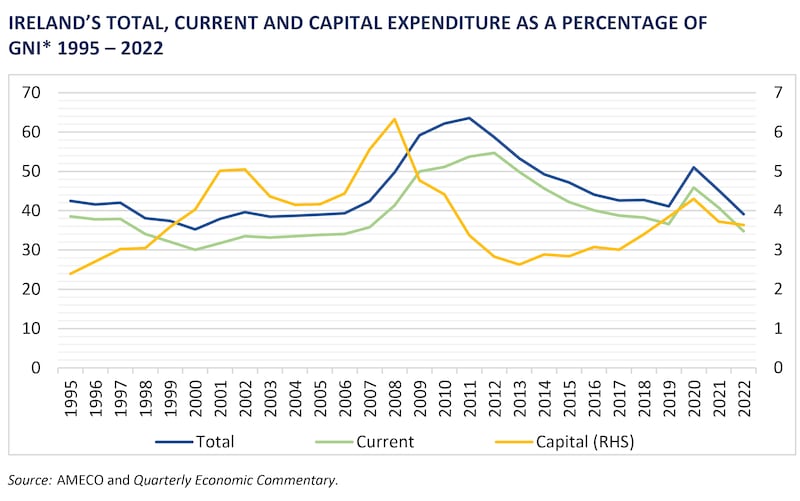
The comparison with GNI* also gives another view in terms of State capital spending, putting its 2022 level at 3.6 per cent of GNI*, below not only the 2007 peak but also the previous high of just over 5 per cent in 2002.
The message here is that investment needs to keep rising not only to continue the catch-up from the post financial crash cuts but also to keep pace with a growing economy.
5. What does it all mean?
The figures show how a rising population and a growing economy – and Government decisions – can push spending higher year on year, with significant changes in per-head spending over the longer term. Ireland’s steady position in the EU league and when looking at spending as a percentage of GNI* do not suggest that the increases of recent years have led to the economy moving markedly out of line internationally in terms of overall spending.
Looking at capital spending, the longer-term dangers of big cuts during a recession are now glaringly evident. The ESRI report also points out that Ireland’s relatively high current ranking in terms of capital spending per head may in part reflect low investment levels in many other EU economies.
Looking at investment as a percentage of GNI* would seem to support this argument – as it does not look particularly higher. Increasing spending in this area, the researchers point out, is complicated by the fact that the economy is currently at or near full capacity. The conundrum, however, is that such investments are also needed to build this capacity in the longer term.
The appropriate level of tax and spending in an economy are inherently political decisions. Ireland has had something of a free pass in recent years from surging corporate tax receipts, allowing spending to rise, taxes to be trimmed and money to be set aside for the future.
The fiscal council and others have warned, however, that choices will sharpen in the years ahead due to pressures on spending from the ageing population and the climate transition.
According to the council, these two combined might cost €13.5 billion annually by the end of the decade, or €3,700 per head. This is the value of 2½ budgets on the scale of the one we have just seen. In time, this will make clear that we cannot aspire to EU-style public services and American levels of tax.


